Friday 29 June 2012

Simple sample?

Sampling is an art. Getting your sampling plans right can make a huge difference to your operations. From business-as-usual quality auditing to ascertaining root cause of problems - how you sample, and the volumes you select can make significant steps to making your job a lot easier.

Your sample must be:
  • Fair and unbiased
  • Representative
  • Appropriately sized
 To ensure your sampling is fair and unbiased, a simple random sample is the easiest way to do it. Simply, give every row in your data set a number (enumerate), then generate random numbers in a separate data set, then join the two together.

Leaving the arguments about truly random numbers aside. There are many reasons why the simple random sample is not enough. Firstly, a random sample will not contain an even distribution of the population size. You may also need your sample to be representative of the population of different categories of data (i.e. 50:50 split between gender, or representative of long lists of variables, like age ranges or product lists).

If you have any questions about sampling, leave in the comments below.

Wednesday 27 June 2012

Data quality - important lesson

This video should be made compulsory for everyone to watch:


So funny, yet so true. Do you know any good data quality videos? If so, please share in the comments below.

Saturday 23 June 2012

Hypothetical and Conditional Syllogism

When talking about the origins of computing, people are likely to mention Sir Clive Sinclair in the 1980's or Konrad Zuse's Z1 in 1936 or Charles Babbage's Analytical Engine in 1837. But these people were more involved in the evolution of the mechanics of computing. In truth, you need to look much further back to find the origins of computer programming and logic.


The Ancient Greeks pioneered western logic that has formed the basis of computer language. In fact Aristotle (384-322bc) introduced the first system, now known as Hypothetical Syllogism.

Hypothetical Syllogism (HS) is a form of classical argument and reasoning by inference. A typical set of hypothetical syllogisms are:
  • If the lights are switched out then the room will be dark.
  • If there is no food then we will go hungry.
  • If it rains, the grass will be wet.
In fact it's very hard to avoid people's verbal use of HS, it is so deeply entrenched into our language and reasoning. HS is most often used in business to convey logic, explore possible outcomes and even to deliver ultimatums. Knowing about HS can really help you to reframe fierce conversations into what they truly are - explorations of hypothetical risk using logical inference.

Anyone who writes code will recognise the ubiquitous "IF  THEN" statements that form the basis of many computing languages. These expressions also had a greek name, and are referred to as Conditional Syllogisms (CS). The logical process is the same, but is used to specify conditions for action or reference.
It is easy to assume that computers are a relatively modern invention, but in truth they have been evolving in our collective consciousness for many centuries.

Friday 22 June 2012

Tools that get you going

You are the proud owner of a nice shiny new Jaguar. It was love at first site. It cost you a stupid amount of money. You had to beg your bank manager for it. But it glides effortlessly down the road. With satisfaction, you notice that everywhere you go, you draw admiring glances and the occasional jealous leer from all who see you. The Jag's advanced engine management and traction control keep it smooth and fast. It has all the latest gadgets to keep you safe, like parking sensors, reversing cameras and intelligent cruise control. Nestled in the opulent luxury, you are truly poetry in motion.

So when an obscure warning light appears on the dashboard and the engine starts misfiring, you take it to the garage. Modern cars are so complex these days with highly advanced engine management systems. Naturally you expect the mechanic to plug your pride and joy into the latest computer to diagnose the problem. Parts can be expensive, so you need to know that the diagnosis is correct.

I'm old enough to remember a time when car mechanics needed little more than a jack, some welding gear and a large array of screwdrivers and spanners! But cars have become far more complex over the years, and you would not expect modern fault diagnosis with a hammer!

Bill Gates famously said, "If GM had kept up with technology like the computer industry has, we would all be driving $25 cars that get 1,000 to the gallon."

While the unofficial reply was quite humorous, Bill was right about how quickly our information technology has advanced. Yet so many business leaders are loathed to invest in staff and tools for data quality and data management.

It is very easy to fall into the trap of valuing your IT infrastructure, and allocating whole departments to keep it up-to-date and running, while overlooking the value of the data. That is like spending all your  money on the roads, and leaving the car mechanics with nothing but spanners.

Thursday 21 June 2012

Cracking your data code

You've been given a project to migrate legacy data onto a new platform. The new entity has been prepared, but for the legacy system, there is no documentation. It is a bespoke system that was built twenty years ago, and all of the developers have left. Your IT professionals know how to fix the legacy batch processes if they break, that's all. Your business leaders know how the screens work and what the correspondence looks like. No-one knows about the data, and it's your job to sort the data out...

How stressed are you??

So how do you get a grip on data that no-one knows about? How do you work out the table structure and the data content? For many people, they would open each table manually and write long sequel to summarise the data. For a large migration, this could feasibly take months. 

But there is another way.
Profiling your data is a way of discovering the content of the data and how the tables are joined together. There are many software manufacturers who make profiling tools, like SAS(Dataflux), IBM(Infosphere), Trillium, Ataccama, Talend etc.  Having a profiling tool available means you can do the following:
  • Discover the content, format and ranges of your data by building statistical models of the data.
  • Follow how the data changes from one day to the next.
  • Map the relationship between data tables and fields across your organisation.
  • Calculate redundant data between related tables.
  • Monitor primary keys to ensure your indexes are correct.
A profiling tool can help developers to discover unknown data sources. It can form the basis for the development of data quality rules, measures and dashboards. Profiling can be done as part of the user acceptance testing of new systems to provide proof that large volumes of test data remain within acceptable tolerances. It really is the swiss-army-knife of data management.

So what's stopping you getting one? I guarantee, you will use it over and over.

Wednesday 20 June 2012

Occam's Razor

Occam's Razor is a philosophy first developed in the middle ages, and was used to discern between differing hypotheses for a phenomenon. The logic stated that when assessing different reasons for why things happen, the explanation that has the fewest assumptions is the one to select as being correct.

It is this simplistic logic that locked us into superstitious and backward thinking for many centuries, as the explanation to our problems with the fewest assumptions was "The Devil did it". Imagine the suffering this blinkered thinking caused!

It is very easy to fall into a trap of blindly using occam's razor when establishing the cause of system problems and any strategies for remediation. There are often too many business and cultural assumptions that can really affect our ability to conduct truly logical analyses. When working through problems with colleagues, you might see these assumptions/beliefs arise:
  • Human error is unavoidable.
  • Certain departments and individuals will not see your point of view.
  • Technical systems cannot be changed.
  • Migrating legacy data to new systems will solve the legacy data problems.
  • The costs outweigh the benefits.
  • There is no-one who can fix the problem. 
To truly examine a problem correctly, the many facets of the problem must be identified (who, how, what, where, when etc), and each hypothesis must be scored against these facets. The most probable hypothesis must explain each facet of the the problem, and must also explain why the inverse does not happen. Once this is done, you can then apply occam's razor about your assumptions - as long as you are truly aware of the assumptions you are working with.

Occam's razor is certainly an interesting way of examining hypotheses, but must be done as a subset of a much more rigorous, systematic methodology. As long as we can be honest about our assumptions, and with a bit of structured thinking, this ancient medieval philosophy can still have it's place in modern business.

Tuesday 19 June 2012

Usage Deviation

Legacy data marts. Unless your company is brand new or very small, there will be plenty of data marts dotted around your servers. When it comes to measuring the quality of the data, many people will go to the original functional specifications to devise the quality rules. If you are lucky, there will have been much thought put into these specifications. You will have all the project documentation, including the original business requirements. However, the truth is that over time these documents can become as aged as the data content.

You may find that other systems and measures will be set up to consume this legacy data - but for different purposes than what was originally intended.  The developers of these additional processes may have made incorrect assumptions about the content of the data or they may have known that the data does not precisely match their requirements, but it is the 'best fit', and they accept their process is not perfect.

  • The schedule of the batch processes that update the data mart may be out of sync with the newer processes.
  • The data mart may not capture all of the data to suit the new purpose.
  • The new processes may have to summarise unnecessary amounts of low granular data every time they run, making them slow and unreliable.
  • The event dates used may be subtly different than what is needed (eg - date keyed against date effective).
So when measuring the quality of your data, it is not enough to simply visit your original mart specifications to devise your business rules. You need to develop a more consumer driven model, based on the context of how the data is used. This context can only be gained by going to your consumers and discovering how they are using your marts. Then you can build measures that assess not only whether your processes are working, but whether the data is still fit for purpose.

Saturday 9 June 2012

Organisational Entropy

Entropy is a concept that has a number of applications, but as a statistical measurement  of thermodynamics, it is the state of disorganisation within the components of a larger system. An example of this is a car battery. When a car battery is fully charged, the molecules are all organised and lined up and there is plenty of charge available for output. This is called a Low Entropy state. As the battery releases it's charge, the molecules become more and more disorganised until there is no charge available for use. This called a High Entropy state.

When applying entropy to businesses, a high entropy organisation has multiple data sources in disparate locations and formats. Data is not collected appropriately and not well managed. There is little or no knowledge about how things work, and colleagues simply carry out their tasks without knowing why, relying on tradition. There are multiple versions of the same measurements and none of them balance or agree leading to decision paralysis at all levels. Operations are siloed in disparate departments without knowledge across these departments, making change very difficult to achieve. Teams, sections and departments have rigid hierarchical structures and agendas and goals are not aligned and in many cases pulling in entirely different directions. Customers of high entropy companies are often frustrated, as they are passed from department to department, chasing up problems, often having to repeat themselves over and over again.

A Low Entropy organisation is the exact opposite. Information is gathered appropriately and stored and managed. Colleagues have detailed knowledge of the systems and processes they use and can make changes when required without creating more errors. Measures balance with each other. There is one version of the truth and colleagues all agree on the state of the business and are able to make the decisions to take things forward. There is close cooperation across teams, sections and departments due to alignment of objectives and goals...... and your customers are happy.

In short... Low Entropy is good.... High Entropy... not so good.

In this blog I will be referring to lowering the entropy of organisations from a data perspective.

Friday 8 June 2012

Problem solving

Solving problems - some of us are good at it; others aren't quite so. But why should that be? We are possibly the best equipped animals on the planet at dealing with them. We have enlarged cerebellums, opposable thumbs and dextrous hands- the best tools for exploring and solving complex problems.

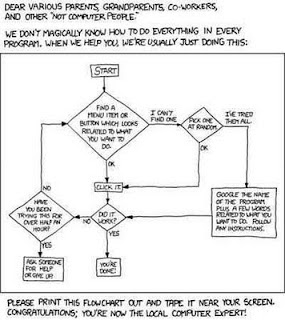
So how come certain people become seen as 'experts' within organisations? They aren't always the smartest people in the organisation. Time after time, the same people get singled out as being the one-stop shop for any kind of complex technical problem - whether it's accessing a new data source or fixing an errant process - they get the call. Yet when you see the decisions they make, they are pretty simple. how many of you remember this picture?


It's amusing but true. The decisions you need to make to solve problems are generally quite simple. But what singles out the people who solve problems well, is their ability to gather enough information to correctly specify them. A decent problem specification will include where the problem is occurring, when it first started, when it finished, the extent of the problem, the impact it has on other related systems and processes etc etc. 

A simple barometer on how effective your problem specifications are, is when raising a problem, does the analyst that the problem is assigned to call the person who raised the error for more information? If your analysts are having to make repeated calls to customers, then not enough information is being gathered when the problem is first raised.

There are methods of specifying problems. my favourite is the Kepner Tregoe problem solving methodology. Check them out http://www.kepner-tregoe.com/.


"The Business" and "IT" Never the Twain Shall Meet?

Talk to a technical person, and they will say "I can't develop this until I get a clear specification from the business". Finding someone in "the business" to answer these questions can be challenging. When you finally find one, they are often likely to say "I can't specify for IT, I don't have the technical knowledge".

And there you have a classic dilemma. Your technical people are not business savvy and focus on the infrastructure and how it works, and your sales and service people are too focused on their customers to make technical decisions. The more you outsource, the greater this problem can become, with contrasting, siloed areas and no over-arching control. This becomes more apparent when contractors are brought in to deliver change, and they cannot obtain the valuable business/technical decisions to move projects forward.

There is real value in treating data as a separate asset from the infrastructure that it resides within. For very often, the most difficult decisions are about the data, rather than the computer systems themselves. Without empowered specialised people who understand the data, the business and the systems, your company is doomed to decision paralysis.

Introduction

I have been working for a financial organisation for over 15 years in various roles, mainly involving data. This is where I share my experience with everyone and encourage people to share their knowledge. Here you will find musings and reflections on all things to do with data management, measurement, control, quality and compliance.